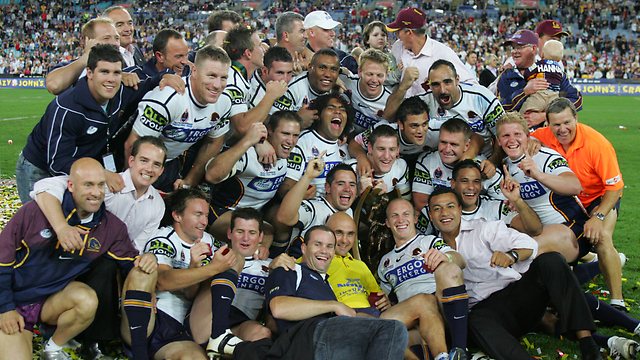
Let us take a trip back in time – ten years to be exact. Back to 2006 when things weren’t as different as it would seem. With the help of The81stMinute’s monkeys (interns), we’ve compared some of the more interesting stats to compare NRL 2016 with the ’06 premiership.
One of the first things we noticed, surprisingly, is the competition was in fact closer in many aspects as the current version. Let’s take a look.

GET ME A BRONCOS THIRD PARTY!
Nothing much has changed about the Brisbane Broncos in ten-odd years. Back in ’06, the eventual premiers had much the star-studded roster as they do in ’16. Brisbane had 14 State of Origin players in their squad and 12 who represented Australia or New Zealand. This season, they have 11 Kangaroos, Kiwis or English stars and 6 Origin players.
Top four sides:
2006: Top four teams in 2006 included 37 Australian, Kiwi or English Internationals
• Broncos boast the most with 12
2006: Top four teams in 2006 included 37 State of Origin players
• Broncos boast the most with 14
2016: Top four teams in 2016 include 30 Australian, Kiwi or English Internationals
• Broncos boast the most with 11
2016: Top four teams in 2016 include 21 State of Origin players
• Broncos boast the most with 6 (along with the Cowboys on 6)
• In 2006, the bottom four sides included 21 State of Origin players
• In 2016, the bottom four sides only include 16 State of Origin players
MORE POINTS SCORED THEN – NOT NOW
55 more points were scored in 2006 in 12 less games (2015). Remember the Gold Coast Titans hadn’t entered the NRL yet so there were only 15 teams.
After 26 Rounds:
2006
• 7,876 points scored (180 games)
• 43.76 average points per game
2015
• 7,821 points scored (192 games)
• 40.73 average points per game
WHAT’S A WINNING RECORD, ANYWAY?
Already in ’16 after only 11 rounds, nine teams have losing records beginning with the Panthers in 8th (5-6) to the 16th place Knights who are 1-9. After 11 rounds of 2006, only five teams had a losing record. The highest placed team with a losing record after 11 rounds were Wests Tigers in 11th (defending premiers at the time).
After 11 Rounds:
• In 2006 (15 clubs), only five teams had losing records
• In 2016 (16 clubs), nine teams have losing records
• In 2006, 2nd place to 5th had 7-3 records
• In 2016, 8th place Panthers have a losing record
• In 2006, the highest place losing record is Wests Tigers in 11th
NOT MUCH HAS CHANGED WITH THE WARRIORS
The Warriors were docked four competition points in 2006 and actually would have made the finals if that hadn’t happened. But at the end of the day they finished tenth in 2006 with a long list of representative players. They continue to struggle today.
• The Warriors 2016 (New Zealand based) boast 9 Kiwi Internationals, 1 Australian and 2 State of Origin players
• The 2006 Warriors included 12 Kiwi Internationals, 2 Australian and 2 State of Origin players
STRUGGLING KANGAROOS
Cronulla are leading the premiership as we speak but it was Struggle Street ten years ago along with the Roosters, Rabbitohs and Panthers. After years of domination, the Roosters fell back to the pack in ’06 despite a bounty of Australian reps. A total of 17 Kangaroos played for the four clubs that finished 2006 at the bottom of the table.
2006
The bottom four sides included 17 Australian Kangaroos
15th Rabbitohs: Shannon Hegarty, Adam MacDougall, David Peachey
14th Roosters: Braith Anasta, Craig Fitzgibbon, Anthony Minichiello, Anthony Tupou, Craig Wing
13th Sharks: Phil Bailey, Brett Kimmorley, Richard Villasanti
12th Panthers: Joel Clinton, Craig Gower, Luke Lewis, Luke Priddis, Luke Rooney, Trent Waterhouse.
2016
The bottom four sides include 10 Australian Kangaroos*
16th Knights: Sione Mata’utia, Kade Snowden, Akuila Uate
15th Roosters: Boyd Cordner, Aidan Guerra, Daniel Tupou
14th Warriors: Ryan Hoffman
13th Wests Tigers: Robbie Farah, Aaron Woods, Chris Lawrence
@woodward_curtis


